What is Infrared Spectroscopy?
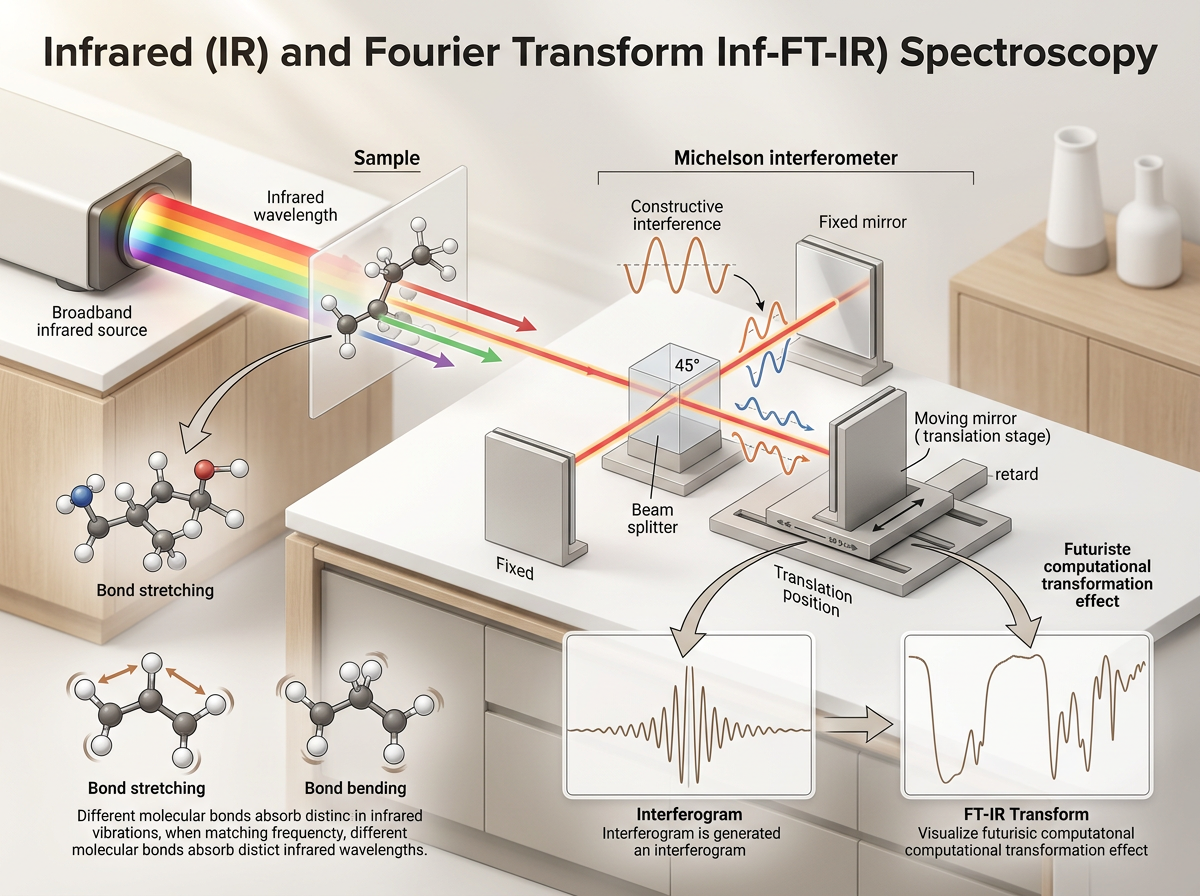
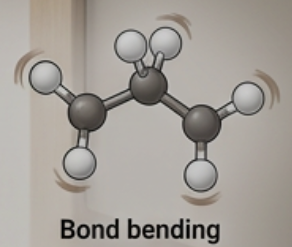
Infrared (IR) spectroscopy is an analytical technique that studies how molecules interact with infrared radiation. When infrared light passes through a sample, certain frequencies are absorbed by the molecules. This absorption occurs because the energy of the infrared radiation matches the energy required for specific molecular vibrations, such as the stretching and bending of chemical bonds. As a result, different molecules absorb infrared light at different wavelengths, producing a unique spectrum that can be used to identify and characterize substances.
Because every molecule has a distinctive arrangement of atoms and chemical bonds, its infrared spectrum acts much like a molecular fingerprint. By examining the positions and intensities of absorption bands, scientists can determine the functional groups present in a compound, distinguish between similar materials, monitor chemical reactions, and verify the identity and purity of samples.
Vibrational spectroscopy is bond-specific, meaning each chemical bond or functional group in a molecule has characteristic vibrational frequencies. For instance, a C=O stretch almost always appears around 1700 cm⁻¹, O–H stretches near 3200–3600 cm⁻¹, and aromatic C–H bends around 700–900 cm⁻¹. Because of this specificity, vibrational spectra provide a fingerprint view of a molecule. In the IR spectrum, especially the region between 1500–500 cm⁻¹, almost every molecule has a unique pattern of absorption peaks — this is called the fingerprint region. Even molecules with the same functional groups but different overall structures can be distinguished here.
For a molecular vibration to absorb infrared radiation, it must produce a change in the molecule's dipole moment. Vibrations that alter the distribution of charge within a molecule are IR active, whereas vibrations that do not change the dipole moment are IR inactive. Therefore, the IR spectrum reflects those molecular vibrations that interact with the electric field of infrared radiation.
Fourier Transform Infrared (FT-IR) spectroscopy
Modern infrared instruments are almost exclusively based on Fourier Transform Infrared (FT-IR) spectroscopy. Unlike older dispersive instruments that separate light into individual wavelengths using prisms or gratings, FT-IR instruments measure all infrared wavelengths simultaneously and then use mathematics to reconstruct the spectrum. This approach provides faster measurements, higher sensitivity, and greater accuracy.
To understand FT-IR spectroscopy, it is first necessary to understand the concept of interference.
The Importance of Interference
Light behaves as a wave. When two light waves meet, they combine according to the principle of superposition. The resulting wave depends on the relative positions of their peaks and troughs.
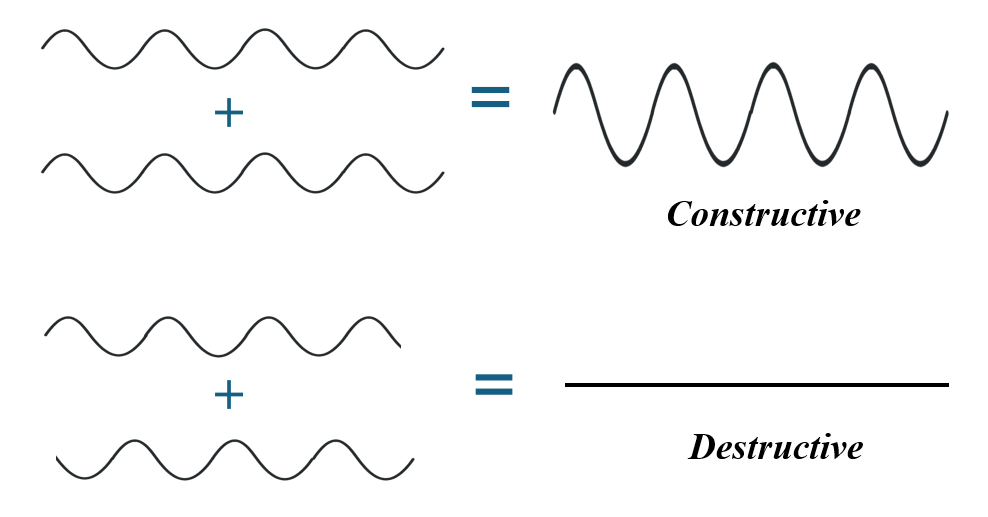
If the peaks of both waves line up with each other, the waves reinforce one another, producing a larger amplitude. This phenomenon is known as constructive interference. The detected light intensity becomes stronger because the waves are adding together.
If a peak of one wave aligns with the trough of another wave, the waves partially or completely cancel each other. This is called destructive interference. In this situation, the detected intensity decreases and may even approach zero.
These alternating patterns of reinforcement and cancellation are the foundation of Fourier transform spectroscopy. Rather than measuring individual wavelengths directly, FT instruments encode wavelength information into an interference pattern that can later be decoded mathematically.
The Challenge of Measuring Infrared Radiation
Infrared radiation oscillates extremely rapidly, typically between approximately 10¹² and 10¹² cycles per second. These frequencies are far too high for electronic detectors to measure directly in real time.
Imagine trying to count the oscillations of a light wave that is vibrating trillions of times every second. Such a measurement is impossible with conventional electronics. FT spectroscopy solves this problem by converting frequency information into a slower, measurable signal through interference.
Instead of observing the light wave itself, the instrument measures how the intensity of the light changes as the optical path length is varied. This creates a signal that contains all the frequency information in a form that can be analyzed mathematically.
The Michelson Interferometer: The Heart of FT-IR
At the center of every FT-IR instrument is a device called a Michelson interferometer. Although the mathematics behind Fourier spectroscopy can appear intimidating, the optical design is remarkably elegant.
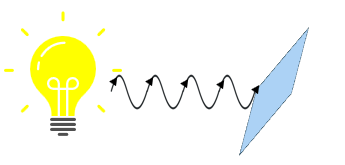
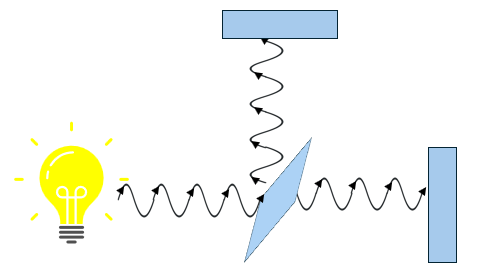
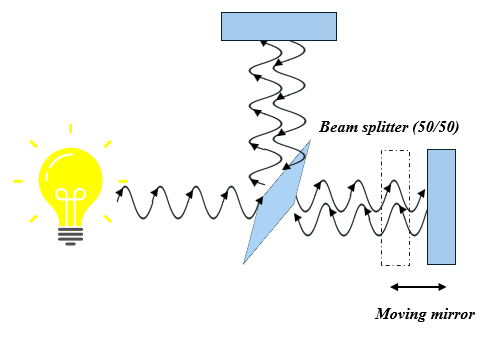
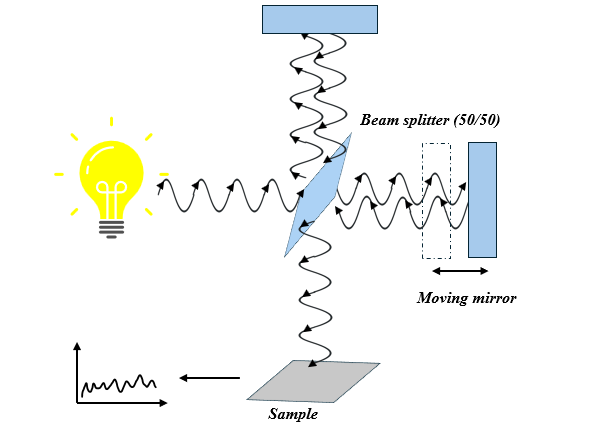
When infrared radiation enters the interferometer, it encounters a beam splitter. The beam splitter divides the incoming light into two separate beams.
One beam travels toward a fixed mirror, while the second beam travels toward a moving mirror. After reflecting from their respective mirrors, the two beams return to the beam splitter where they recombine and continue toward the detector.
If both beams travel exactly the same distance, they arrive in phase and interfere constructively. If one beam travels a longer distance than the other, a phase difference develops between them. Depending on the magnitude of this path difference, constructive or destructive interference occurs.
The moving mirror continually changes the optical path length difference between the two beams. As a result, the intensity reaching the detector rises and falls in a predictable manner.
The path difference, often called the retardation S, is given by
S=2(M−F)
where M and F represent the positions of the moving and fixed mirror arms. The factor of two appears because the light must travel to the mirror and back, effectively doubling the path difference.
This changing path difference is what generates the interference pattern used in FT spectroscopy.
Why Different Wavelengths Behave Differently
The key insight of Fourier spectroscopy is that different wavelengths respond differently as the mirror moves.
Short wavelengths complete many oscillations over a small mirror displacement. Their interference patterns therefore fluctuate rapidly.
Long wavelengths oscillate more slowly and produce much broader interference features.
When the source contains many wavelengths, each wavelength generates its own interference pattern simultaneously. The detector records the combined result of all these overlapping signals. At first glance, the recorded signal appears to be a complicated collection of waves. However, hidden within that signal is information about every wavelength present in the infrared beam.
This recorded signal is known as an interferogram. An interferogram is not a spectrum. Rather, it is a compact representation containing all spectral information mixed together in the time or distance domain.
From Interferogram to Spectrum: The Fourier Transform
Although the interferogram contains information from every wavelength, that information is not immediately obvious. This is where mathematics enters the picture. A Fourier transform is a mathematical operation that separates a complex signal into its individual frequency components. In much the same way that a musical chord can be decomposed into individual notes, an interferogram can be decomposed into the infrared frequencies that produced it. After the interferogram is collected, a computer performs a Fourier transform and converts the signal into the familiar infrared spectrum showing intensity as a function of wavenumber.
The final spectrum reveals where the sample absorbs infrared radiation, allowing scientists to identify functional groups, investigate chemical structure, and characterize unknown materials. In essence, the interferometer encodes the wavelength information, while the Fourier transform decodes it.
Why FT-IR Replaced Dispersive Infrared Spectroscopy
The dominance of FT-IR spectroscopy stems from several significant advantages over traditional dispersive instruments. One of the most important is the Jacquinot advantage, often called the throughput advantage. Traditional dispersive spectrometers use narrow slits and gratings to isolate individual wavelengths. These optical elements block a large fraction of the available light before it reaches the detector. An FT-IR instrument does not require such restrictive slits. Consequently, much more radiation reaches the detector, producing stronger signals and better sensitivity. The improved signal-to-noise ratio becomes especially valuable when analyzing weakly absorbing samples. A second advantage is the Fellgett advantage, also known as the multiplex advantage. In dispersive instruments, wavelengths are measured sequentially, one after another. This process can be relatively slow because the instrument must scan through the entire spectral range. In an FT-IR instrument, all wavelengths are measured simultaneously. The complete spectral information is collected in a single interferogram and later separated mathematically. This dramatically reduces acquisition time while often improving data quality. Another major benefit is the exceptional precision of the wavenumber scale. Traditional spectrometers depend on the mechanical accuracy of gratings or prisms, which can drift over time. In contrast, FT instruments use an internal reference laser to track mirror position with extraordinary precision. This provides highly reproducible wavelength calibration and allows spectra obtained in different laboratories to be compared directly with confidence.
Why FT-IR Is So Powerful
The brilliance of FT-IR spectroscopy lies in the fact that it transforms a difficult measurement into a manageable one. Instead of trying to detect trillions of optical oscillations every second, the instrument measures interference patterns generated by controlled changes in optical path length. The Michelson interferometer converts wavelength information into an interferogram, and the Fourier transform converts that interferogram back into a spectrum.
The result is a technique that is fast, sensitive, precise, and remarkably versatile. Whether identifying organic compounds, monitoring industrial processes, studying polymers, analyzing pharmaceuticals, or investigating biological materials, FT-IR spectroscopy provides a window into the molecular world by translating tiny vibrational motions into measurable spectral fingerprints.
For this reason, FT-IR has become one of the most important analytical tools in modern chemistry, materials science, environmental monitoring, and pharmaceutical research. It combines elegant physics, sophisticated mathematics, and practical instrumentation to answer one fundamental question: what molecules are present, and how are they structured?