Understanding How Molecules Interact with Light
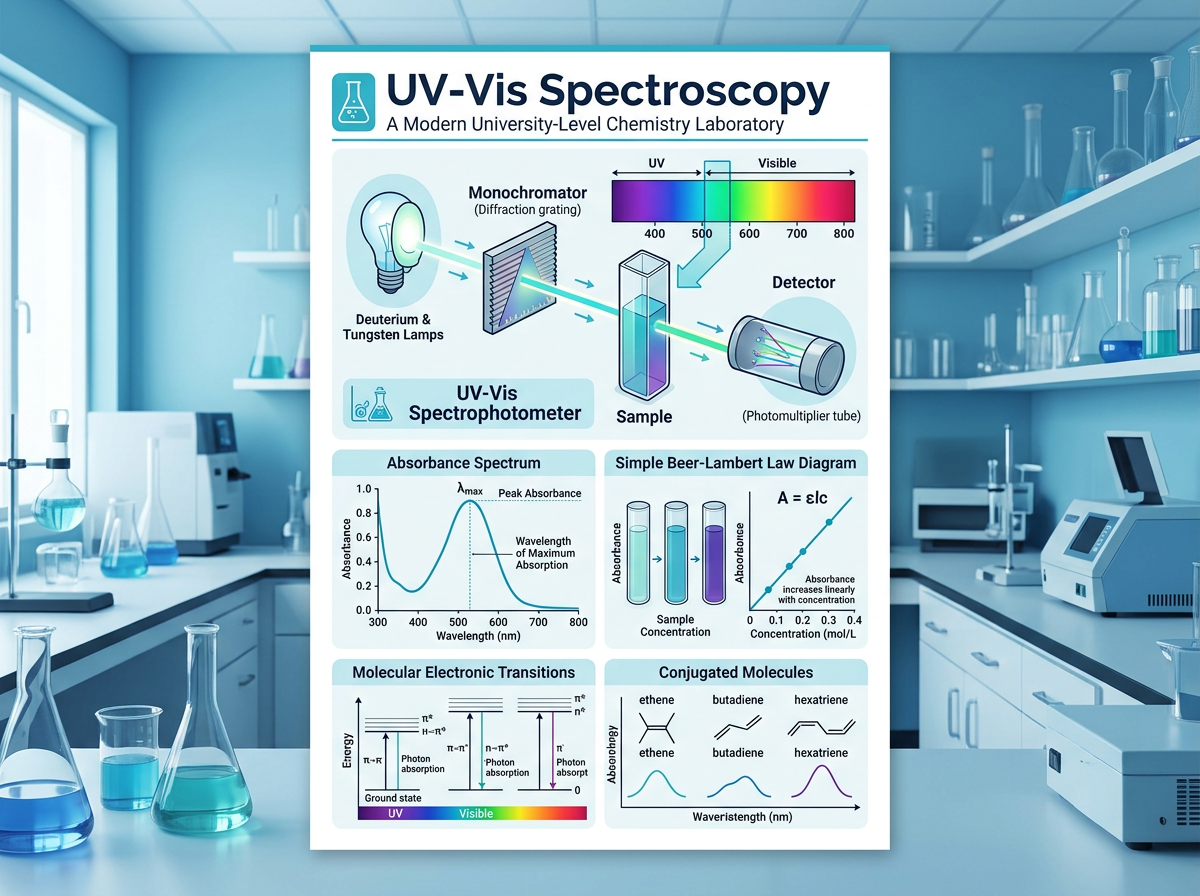
UV-Visible (UV-Vis) Spectroscopy is one of the most widely used analytical techniques in chemistry, biology, environmental science, pharmaceuticals, and material science. At its core, UV-Vis spectroscopy measures how much ultraviolet and visible light a substance absorbs. By examining this absorption, scientists can determine the concentration of a sample, identify chemical species, study reaction kinetics, and gain insight into molecular structure.
When a beam of light passes through a sample, some wavelengths may be absorbed while others pass through. Absorption occurs when the energy of the incoming light matches the energy difference between electronic states within a molecule. Electrons absorb this energy and become promoted from lower-energy orbitals to higher-energy orbitals. The amount of light absorbed can then be measured and related to the sample's properties.
One of the most important quantities measured in UV-Vis spectroscopy is absorbance. Absorbance describes how much light is absorbed by the sample relative to the incident light entering the system. Unlike percent transmittance, absorbance provides a direct mathematical relationship with concentration, making quantitative analysis straightforward and highly reliable.
Beer-Lambert Law
The foundation of quantitative UV-Vis spectroscopy is the Beer-Lambert Law, one of the most important equations in analytical chemistry:
A = εbc
where:
A = Absorbance
ε = Molar absorptivity (extinction coefficient)
b = Path length of the sample cell
c = Concentration of the analyte
This relationship shows that absorbance is directly proportional to concentration. As concentration increases, absorbance increases proportionally, provided that the system remains within the linear range of the instrument. Because of this relationship, UV-Vis spectroscopy has become one of the most common techniques for determining unknown concentrations in laboratory and industrial settings.
A typical UV-Vis instrument consists of a light source, wavelength selector, sample compartment, detector, and data processing system. The instrument scans across a range of wavelengths and records the absorbance at each wavelength, producing an absorption spectrum. Peaks in the spectrum correspond to wavelengths where the sample absorbs light most strongly.
The location and intensity of absorption bands depend on the structure of the molecule. Compounds containing conjugated double bonds, aromatic rings, and various chromophores often produce strong UV-Vis absorption signals. As conjugation increases, absorption typically shifts toward longer wavelengths, a phenomenon known as a bathochromic (red) shift. These spectral shifts allow chemists to investigate molecular structure and electronic properties.
UV-Vis spectroscopy is widely used for constructing calibration curves, where absorbance measurements from standards of known concentration are plotted against concentration. Once the calibration curve is established, the concentration of unknown samples can be determined quickly and accurately. This approach is used extensively in pharmaceutical analysis, water quality monitoring, food science, and biochemical research.
Beyond simple concentration measurements, UV-Vis spectroscopy can be used to monitor chemical reactions in real time. By measuring absorbance changes during a reaction, scientists can determine reaction rates, study reaction mechanisms, and investigate equilibrium processes. This makes UV-Vis a powerful tool for kinetic and thermodynamic studies.
Modern UV-Vis instruments often include advanced features such as diode-array detectors, rapid spectral acquisition, and computer-assisted data analysis. These capabilities allow researchers to collect complete spectra within seconds and perform sophisticated quantitative and qualitative analyses.
Why UV-Vis Spectroscopy Is Important
UV-Vis spectroscopy remains one of the most valuable analytical techniques because it is:
Fast and relatively inexpensive
Non-destructive to many samples
Highly quantitative
Easy to operate
Applicable to a wide variety of fields
Capable of real-time reaction monitoring